AEOsim blog
How many chats is enough?
Table of contents
One answer is one draw
Ask an AI engine the same buying question twice and you can get two different shortlists. Each response is one sample from a distribution of possible answers. A visibility number built on one sample per prompt is a screenshot, not a measurement.
So the real question behind any AI visibility report is: how many chats sit behind this number, and how wide is the uncertainty around it?
Here is a concrete case. In AEOsim's constraint experiment, the brand listed first at discovery became the final recommendation in 6 of 65 constrained chats (Chat Is the New Funnel). That is 9%, and the 95% confidence interval runs from about 3% to 17%. Sixty-five chats were enough to show a dramatic effect (100% in the neutral arm versus single digits). They were not enough to say whether the true rate is closer to 4% or 15%.
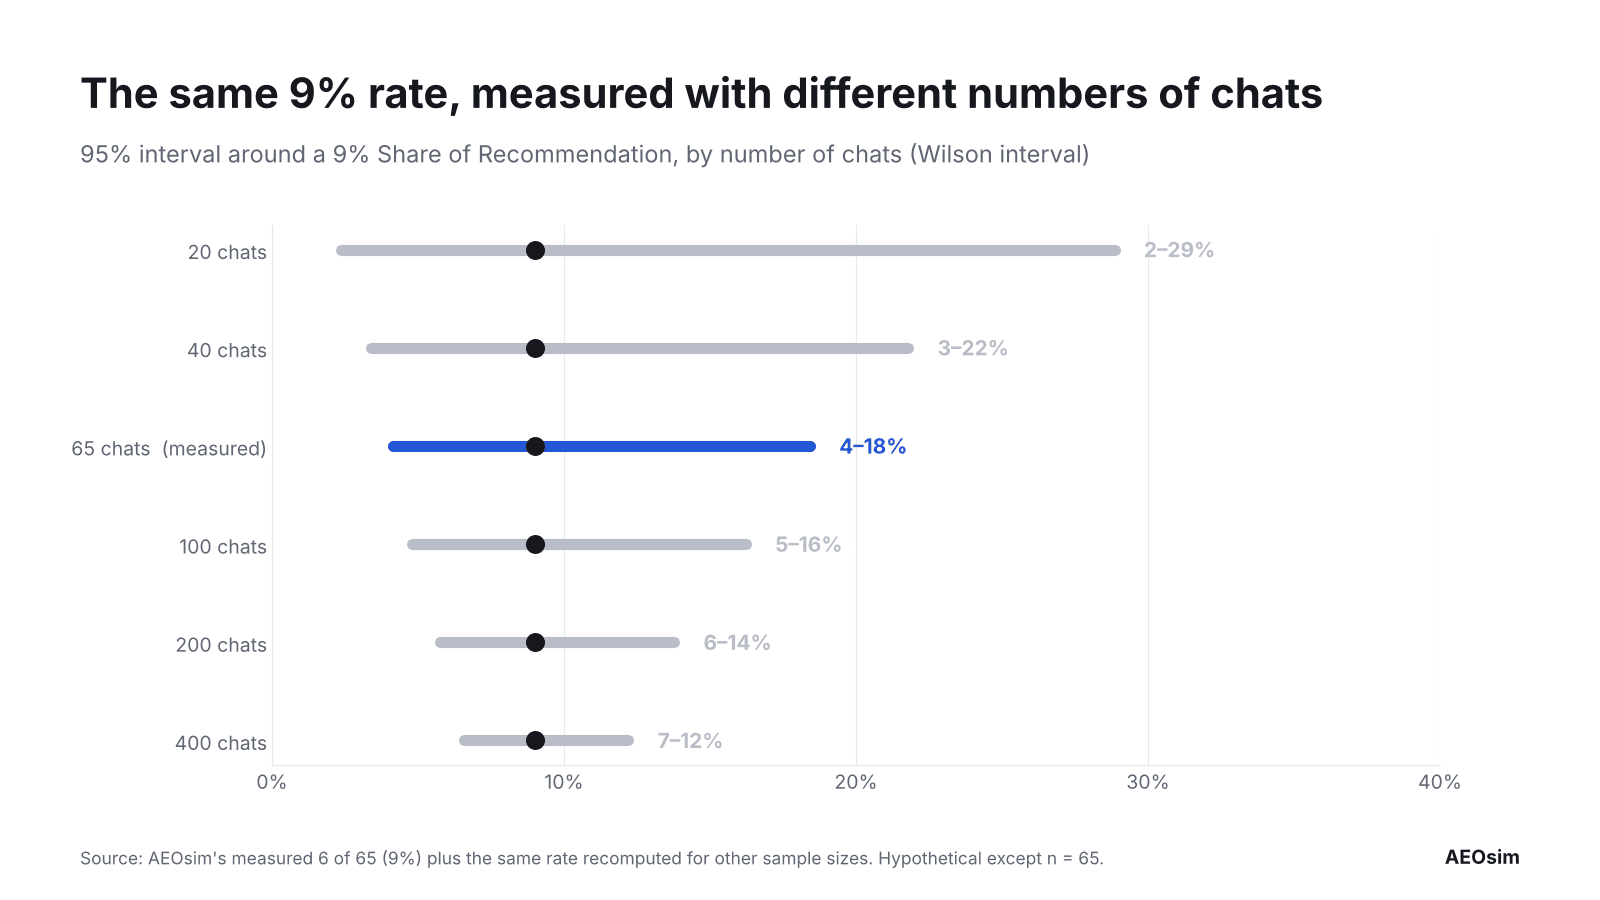
That is the right way to read every visibility number: as a range, with a sample size attached.
Confidence intervals, in plain terms
A 95% confidence interval is the range a rate plausibly sits in, given how many chats you ran. More chats, narrower range. The width shrinks with the square root of the sample, so halving the uncertainty costs four times the runs.
The table shows the approximate 95% margin of error for a measured rate, using the simple normal approximation. The 50% column is the worst case; the 10% column fits a brand that rarely wins.
| Chats run | Margin if true rate ≈ 50% | Margin if true rate ≈ 10% |
|---|---|---|
| 10 | ±31 points | ±19 points |
| 20 | ±22 points | ±13 points |
| 40 | ±16 points | ±9 points |
| 65 | ±12 points | ±7 points |
| 100 | ±10 points | ±6 points |
| 400 | ±5 points | ±3 points |
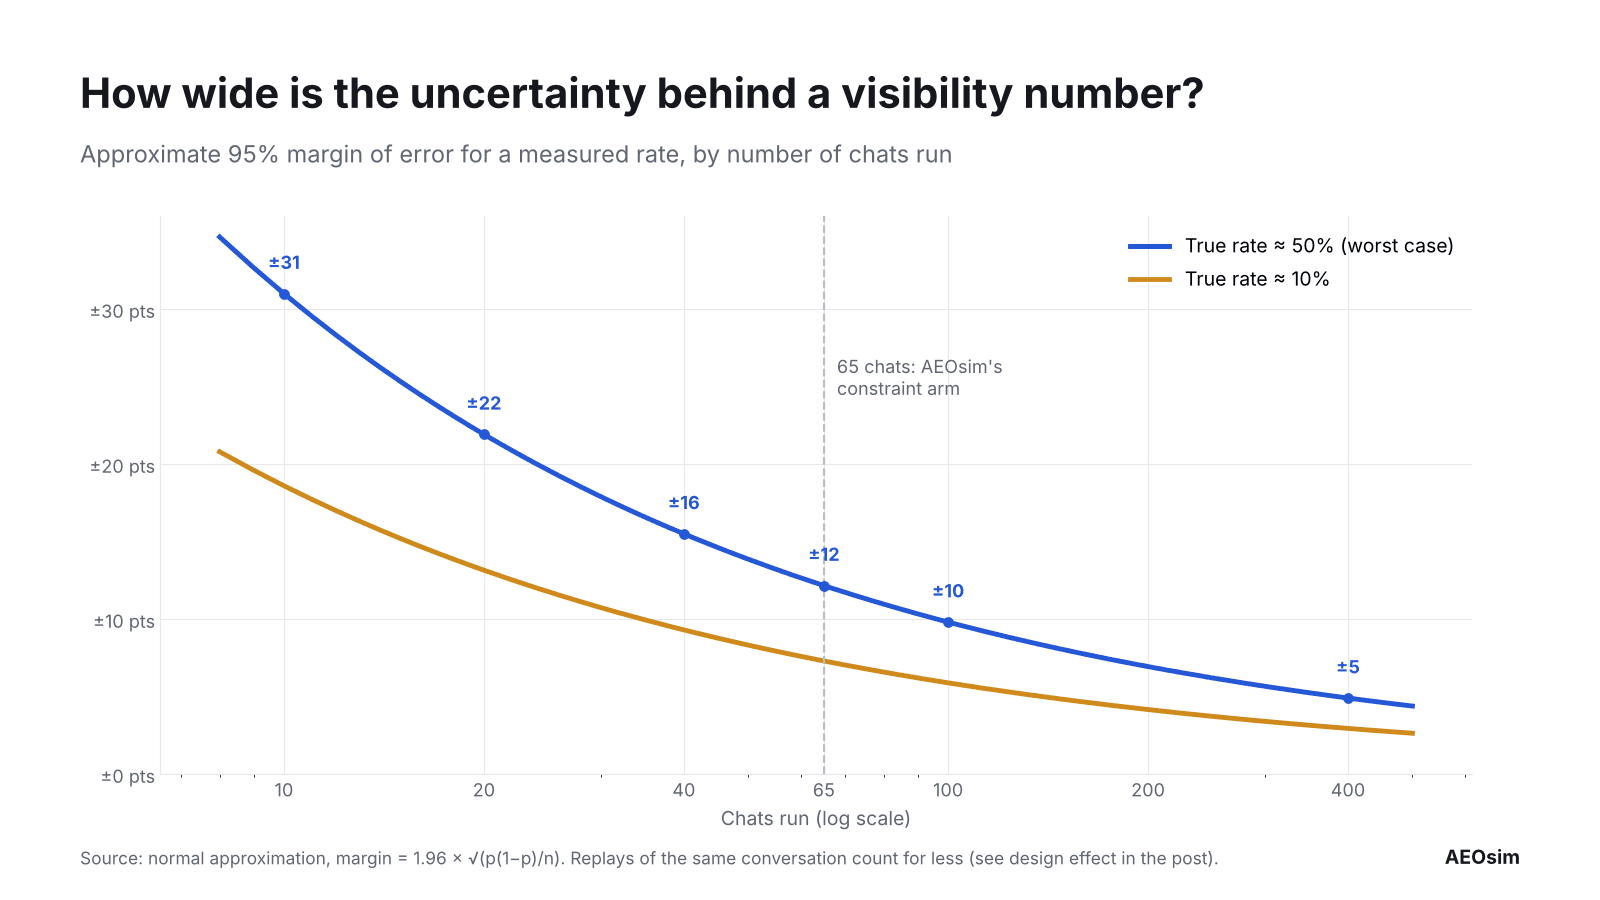
Read it this way. If a dashboard says your Share of Recommendation moved from 40% to 48% this month, and each number came from 40 chats, that move sits well inside the noise. It may be real. The data cannot tell you yet.
Two practical rules:
- Never report a rate without its sample size. "48% (n=40)" is honest. "48%" alone is not.
- Match precision to the decision. Deciding whether to rewrite one PDP needs less precision than deciding a quarter's content budget.
Replicates are not the same as unique flows
There are two ways to get to 60 chats. You can run 60 different buying conversations once each, or run 12 conversations five times each. They are not equally informative.
Replays of the same conversation are correlated. The engine tends to give similar answers to identical inputs, so the fifth replay tells you less than the first. Survey statisticians handle this with a design effect: the effective sample size is the number of chats divided by 1 + (replicates − 1) × ρ, where ρ is how similar replays of the same conversation are.
For 12 conversations × 5 replays = 60 chats:
- If replays are only mildly alike (ρ = 0.2), the 60 chats behave like about 33 independent ones.
- If they are strongly alike (ρ = 0.5), they behave like about 20.
- If they are nearly identical (ρ = 0.8), they behave like about 14.
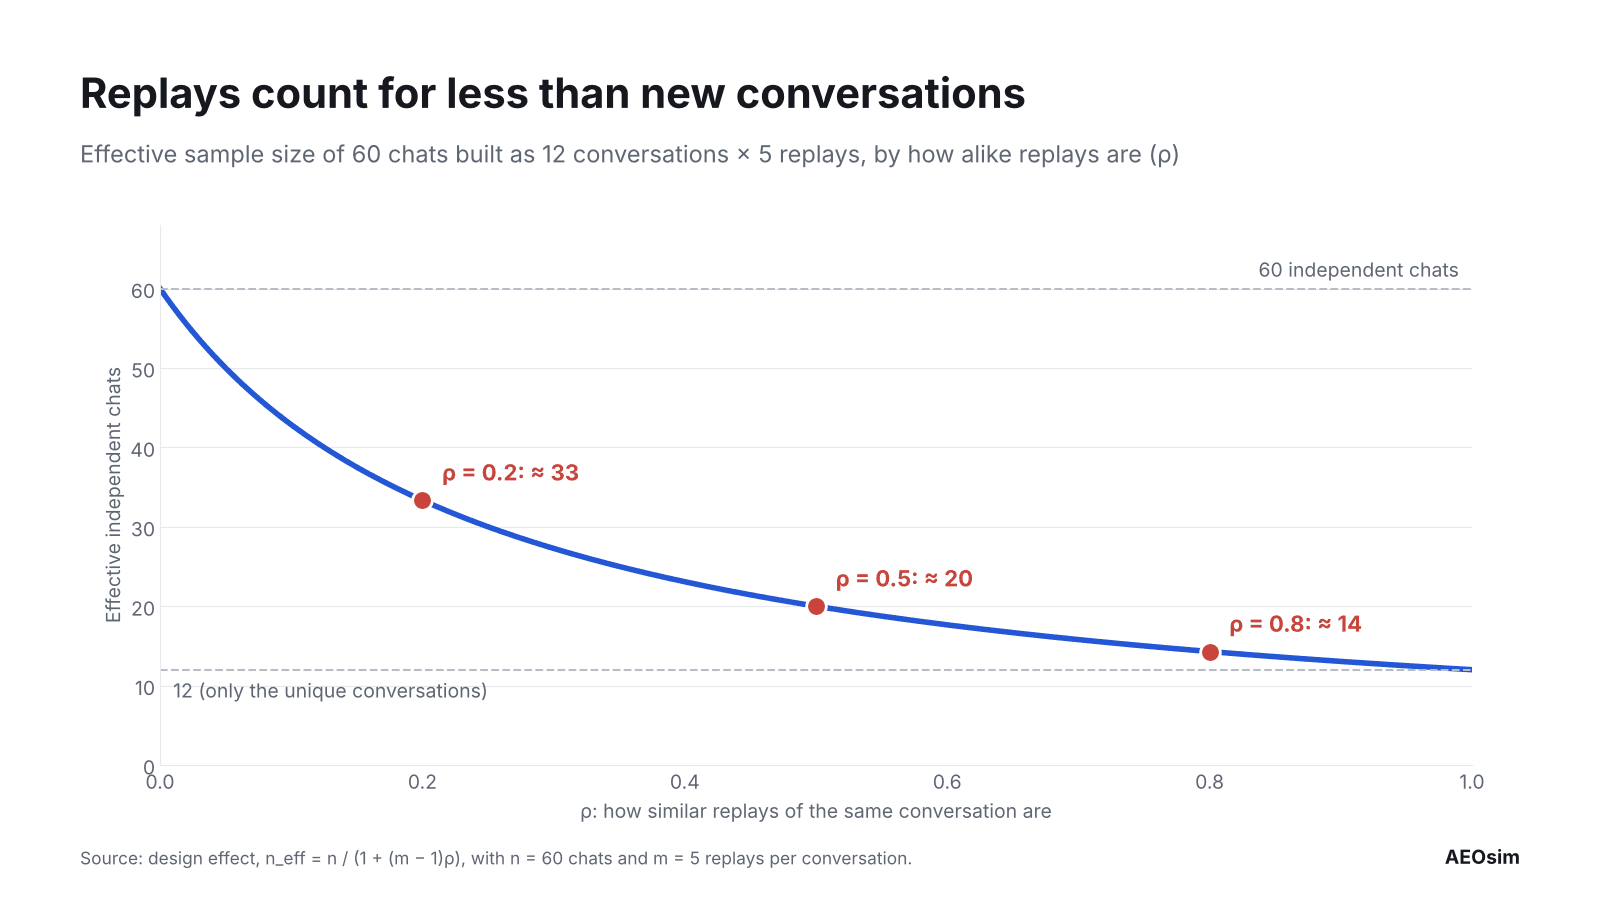
So replays answer one question (how stable is the answer to this exact conversation?) and unique flows answer another (how does the brand fare across the range of ways buyers ask?). You need both. A report built entirely from replays of a handful of scripts overstates its own precision.
How many replays per conversation?
Enough for the answer distribution to stop moving. In a 50-prompt convergence study on the Gemini API, no prompt stabilised in fewer than 8 runs, the median among those that stabilised was 15, and half had not stabilised by 20 (AEOsim tool comparison). Prompts that never settled pulled in more cited sources per answer, roughly 13 versus 8.
That gives a working floor. Single-run daily sampling, which many tools still use, is far below it.
A practical run budget
For one category on one engine, a reasonable starting design:
- Write at least 8 distinct buying conversations covering your main personas and constraints.
- Replay each one 15 to 40 times. Fewer than 15 rarely converges; 40 replays of a five-turn ladder also gives enough transitions to estimate drop and recovery rates (Visibility Has Two Axes).
- Report every rate with n and an interval, and report it per conversation as well as pooled.
- Spend extra runs where answers disagree. Conversations your brand always wins or always loses are settled. The ones near 50/50 carry the most information and deserve the budget (Play the Games You Might Lose).
- Hold a fixed anchor set across months so a change in the number reflects the brand, not a change in the prompts.
This is a starting point, not a universal rule. Unstable categories and high-stakes decisions need more. A quick directional check needs less, as long as it is labelled as directional.
Related reading: Chat Is the New Funnel · Building a prompt set that represents real buyers · Why AI visibility tools disagree
See your numbers with their intervals. Book an Analytika demo.