AEOsim blog
Why AI visibility tools disagree (extended)
Table of contents
Same brand, different numbers
Run one brand through three AI visibility tools and you will usually get three different scores. That is not proof that two of them are broken. Each tool makes five quiet methodological choices, and different choices measure different things. Two single-run tools can both be correct about different draws from the same distribution.
The problem is that most tools never say which choices they made. A buyer sees "34% visibility" on one dashboard and "51%" on another, with no way to tell which number reflects their buyers.
This post extends AEOsim's earlier work on tool disagreement with the full comparison data from our 17-criterion review of seven tools. It explains where disagreement comes from, what the scores showed, and eight checks you can run on any AI visibility tool in under a week.
The five silent choices behind every score
1. Which surface was probed
There is no single "ChatGPT". The raw API, the logged-out web app, and the logged-in app (with memory and custom instructions) return different answers. Real buyers live in the logged-in app. Most tools probe the API, because it is cheapest. In our comparison, only 2 of 7 tools verifiably probed the user-facing interface rather than the raw API.
2. Which prompts were asked
A prompt set built from SEO keywords measures something different from one built from sales calls and support tickets. Branded prompts ("is Brand X good for…") inflate scores if they are blended with unbranded category prompts. Two tools with different prompt sets are measuring different buyer universes.
3. How many times each prompt ran
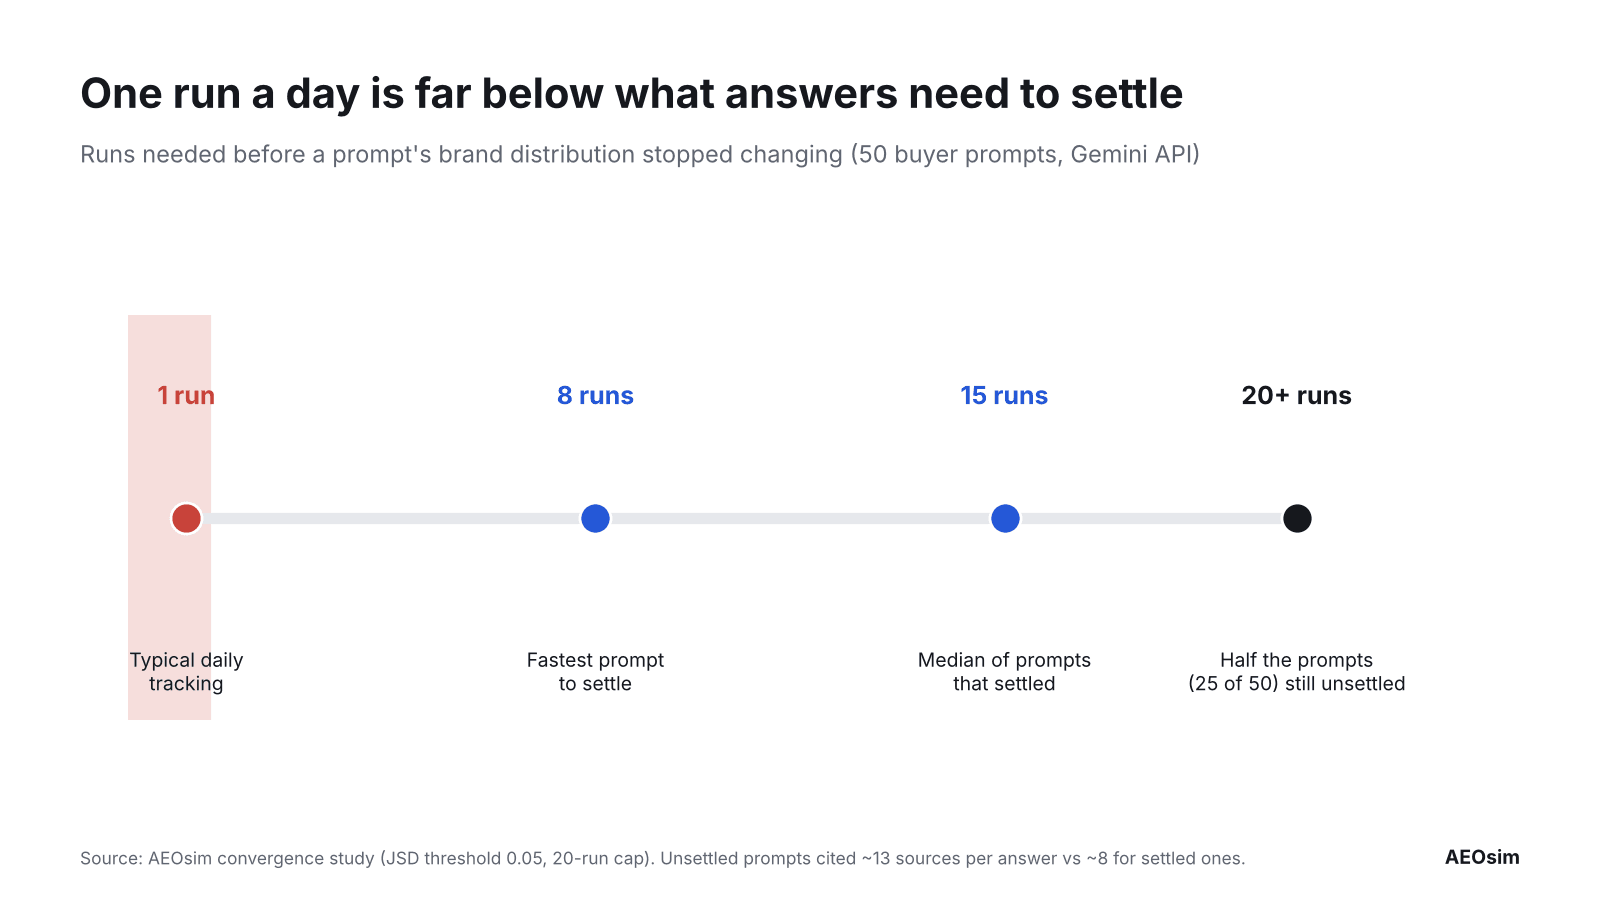
A single AI response is one draw from a distribution. In a 50-prompt convergence study on the Gemini API, 25 prompts had not stabilised after 20 runs. The fastest stabilised at 8 runs, and the median among those that did stabilise was 15. Yet most products still sample each prompt once per day.
4. Which turn was measured
Nearly every tool measures the first response. Buying decisions happen several turns later, after the buyer adds a budget or an objection. In AEOsim's constraint experiment, the first-listed brand won 100% of neutral chats and 9% of constrained ones (Chat Is the New Funnel). A turn-one score and a decision-turn score can point in opposite directions.
5. How retrieval was handled
Some answers come from the model's training data; others come from live web search. Whether a tool forces search, allows it, or ignores it changes which brands appear. A mention from model memory and a mention from a retrieved page need completely different fixes.
What the seven-tool comparison showed
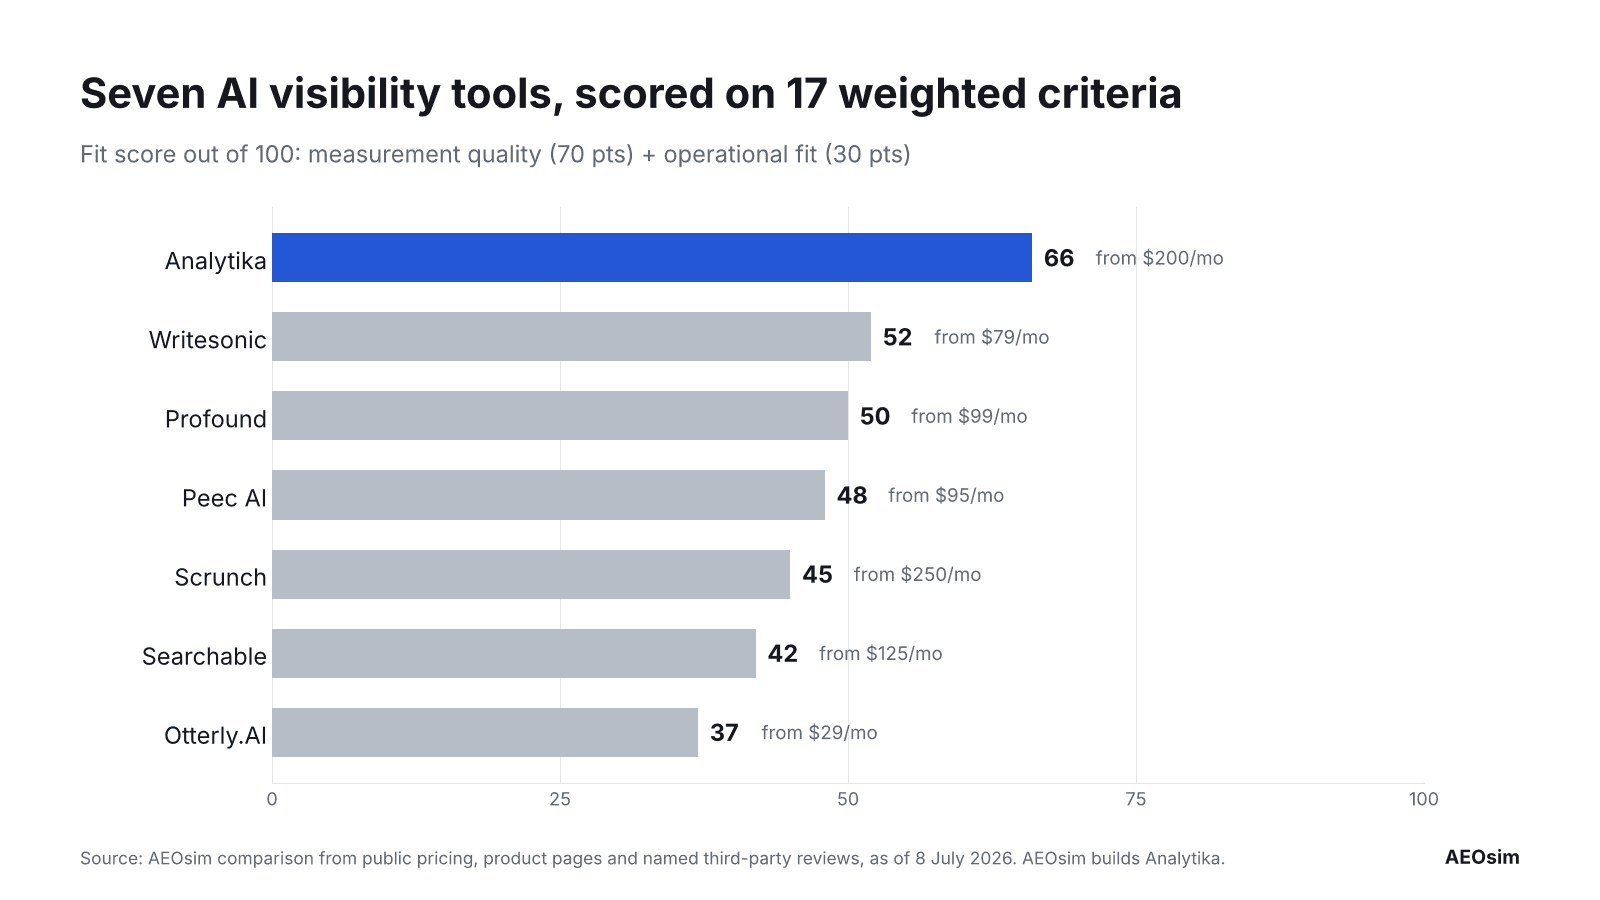
AEOsim scored seven tools on 17 weighted criteria: 12 measurement-quality criteria worth 70 points and 5 operational-fit criteria worth 30. Scores came from public pricing and product pages plus named third-party reviews, as of July 8, 2026.
| Tool | Fit score /100 | Entry price /mo | Main limitation to validate |
|---|---|---|---|
| Analytika | 66 | $200 | Longer setup for custom BI; narrower engine and sector coverage |
| Writesonic | 52 | $79 | Probe surface and dataset provenance undisclosed |
| Profound | 50 | $99 | Run methodology and surface not disclosed publicly |
| Peec AI | 48 | $95 | Single-run daily sampling |
| Scrunch | 45 | $250 | Prompt refresh frequency undisclosed; heavy setup |
| Searchable | 42 | $125 | One run per prompt per engine per day, by arithmetic |
| Otterly.AI | 37 | $29 | Confirm whether UI or API is probed |
Three honest caveats belong with this table:
- We built one of the tools. Analytika is AEOsim's product. The rubric weights measurement rigour at 70%, which favours a measurement-first tool. A content-led team could rationally prefer a tool ranked lower here.
- Scores reflect public information. Where a tool does not disclose its method, it was scored conservatively. A demo can change that.
- No tool scored above 7/10 on latent authority. Separating mentions from model memory versus live retrieval is an open problem for everyone, us included.
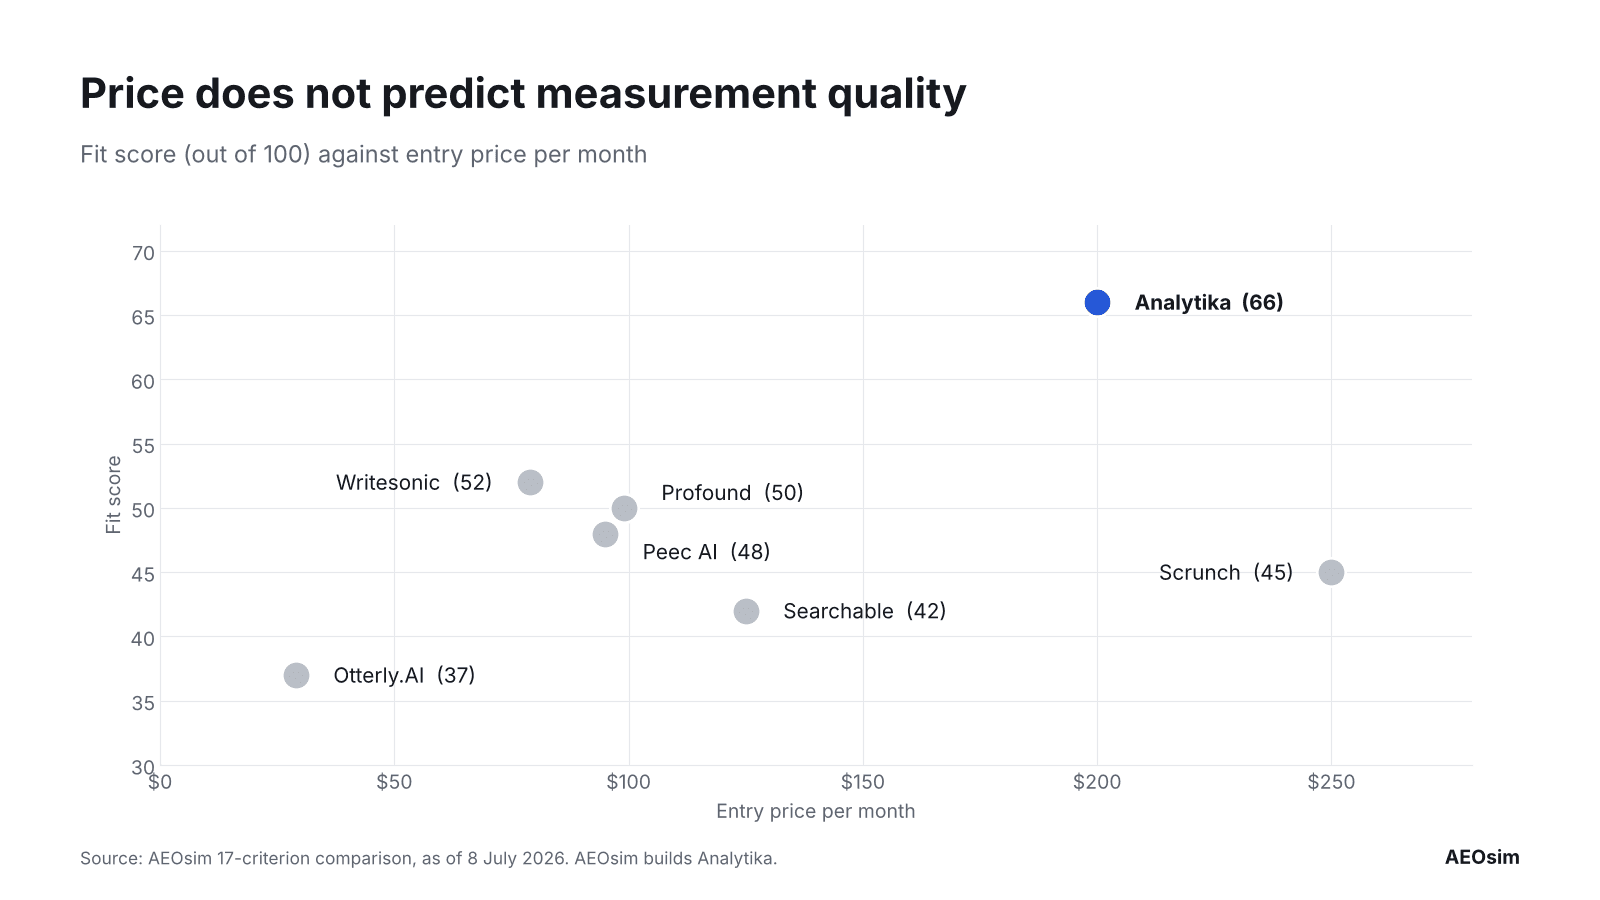
The pattern matters more than the ranking. Tools cluster by what they were built to do cheaply. Self-serve monitors are affordable and fast but rarely report variance. Enterprise platforms have broad engine coverage but seldom disclose sampling. Almost none measure multi-turn conversations. Those gaps, not tool quality alone, explain most disagreement.
Eight checks to run before you trust any tool
These work on any tool, take under a week combined, and apply to Analytika as much as anyone else.
| # | Check | Ask the tool to show | Pass | Fail |
|---|---|---|---|---|
| 1 | 20-run stability | One prompt run 20 times, with variance | A distribution with a CI | A single number |
| 2 | Surface | Which system produced the dashboard | Named surface plus correction method | "Proprietary methodology" |
| 3 | Branded split | Visibility by prompt class | Two numbers, two diagnoses | One blended score |
| 4 | Prompt provenance | Where 10 sample prompts came from | Traceable to demand data or your BI | Keyword expansion |
| 5 | Personas | Same intent, two personas | Different results, reported per persona | One generic asker |
| 6 | Multi-turn | Brand presence across a 3-turn script | Entry and exit per turn | Turn one only |
| 7 | Crawl logs | Citations next to your 30-day AI-bot logs | Crawl-vs-cite diagnostics | "Logs aren't part of it" |
| 8 | ROI | One insight as pipeline exposure | A currency range with assumptions | A mention percentage |
If you only have time for one, run check 1. Ask for the same prompt twenty times and look at the spread. A tool that cannot show you that spread is reporting a single draw as if it were a fact.
Related reading: Chat Is the New Funnel · How many chats is enough? · Conversation analytics vs prompt tracking vs GA4 referrals
Want to see these checks run on your category? Book an Analytika demo to see how Analytika handles stability, the branded split and multi-turn tracking.