AEOsim Blog
Visibility Has a Third Axis: Separating Brand Exclusion from Engine Incoherence in Multi-Turn Drop Rates and Half-Life
Follow-up to Visibility Has Two Axes: variance and drift. This piece adds coherence, and shows how to separate brand exclusion from engine forgetfulness in the drop rate.
Table of Contents
An earlier post set out two axes of AI search visibility. The first is variance, the run-to-run wobble you get from sending the same prompt twice, which is symmetric, shrinks as you add runs, and is handled well enough by repeated sampling. The second is drift, which happens across the turns of a conversation, and here resampling the opening question a thousand times buys you nothing about turn three. Brands routinely sit at 72 percent on the first question and are gone by the third. Sample only the opening and you get 72 percent with a tight interval around a slice of the conversation that most buyers walk straight past.
That post fitted a two-state chain over brand presence, produced a drop rate and a recovery rate, and turned those into a visibility half-life. The chain still looks right. The worry now is about the quantity being fed into it, because a drop rate counts every disappearance the same way regardless of what caused it.
Two conversations, one log
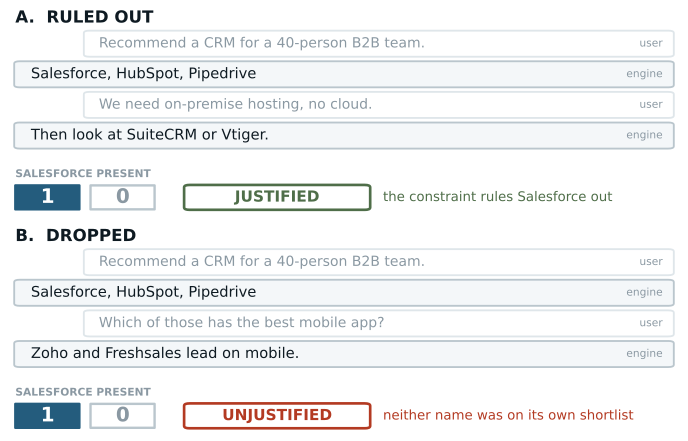
In the first one the user says they need on-premise hosting. Salesforce is cloud, so it goes. The engine behaved correctly, and the drop tells you something real: there is a segment where your positioning does not survive contact with a constraint. You can act on that, either by fixing the gap or by deciding you are happy to lose those buyers.
In the second one the user asks a narrowing question about mobile apps and the engine answers with two names that were never on its own shortlist. Nothing got ruled out. The engine just stopped tracking what it had said one turn earlier.
Both conversations log the same thing for Salesforce, present and then absent, so a chain fitted on presence indicators records one drop either way. The first drop tells you how your brand fares against a real constraint. The second tells you something about the engine's working memory and nothing whatsoever about your brand.
The third axis
Variance and drift are both magnitude questions: how far apart the runs were, how far the brand fell by turn four. Whether the fall was reasoned is a different question, and nothing in the current toolkit puts it.
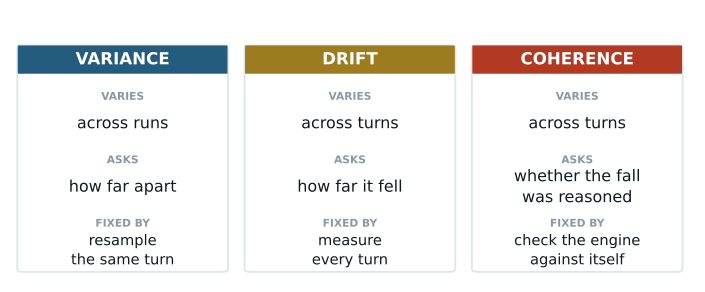
Coherence is whether the engine's later turn holds together with its own earlier turn inside the same conversation. Because it sits on the turn axis alongside drift, an incoherent drop just looks like more drift, and in a mention log the two are indistinguishable.
Splitting the drop rate
Write Y for whether the brand is present at a given turn. In the two-state chain from the earlier post, presence survives one turn with probability 1 − d, so it survives k of them with probability
S(k) = (1 − d)ᵏ
Hazards are easier to work with than probabilities here. Write h = −ln(1 − d) for the per-turn rate of loss. Half-life is then
t½ = ln 2 / h
Now put both mechanisms into the model. At a turn where the brand is present, it can be removed because the user introduced a constraint that disqualifies it, which happens with probability δ, or because the engine lost track of its own shortlist, which happens with probability λ. The brand survives only if neither occurs, and assuming the two act independently, an assumption I will come back to and test,
1 − d = (1 − δ)(1 − λ)
Take logs, and the hazards simply add:
h = h(brand) + h(engine)
Since half-life is inversely proportional to hazard, this gives the first result worth stating on its own:
1 / t½ = 1 / t½(brand) + 1 / t½(engine)
Half-lives combine the way parallel resistances do. Whatever you observe is shorter than both of the quantities producing it, and it gets pulled toward whichever of the two is smaller. An engine with a short coherence half-life drags your reported number down however well the brand is positioned, and no amount of content work moves the term responsible.
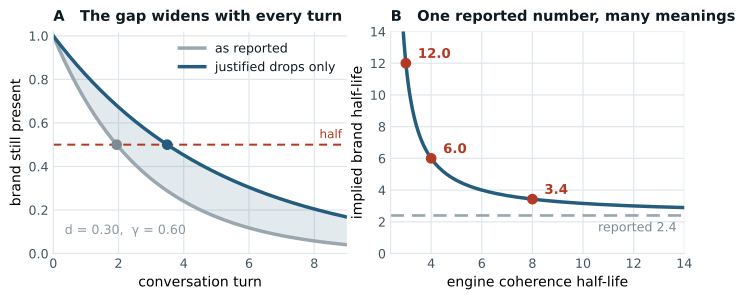
Define γ as the share of the total hazard that comes from genuine exclusion. Then the half-life attributable to your brand follows directly:
γ = h(brand) / h, t½(brand) = t½ / γ
Reported half-life understates the brand-attributable one by a factor of 1/γ. Parameterised this way the correction is exact rather than a small-d approximation, which is the main reason to work in hazards at all.
What it costs
Engine A is reported ahead of Engine B whenever h(A) < h(B), since that is all a drop rate can see. On corrected numbers A leads when γ(A)·h(A) < γ(B)·h(B). Putting those together, the two orderings disagree exactly when
γ(A) / γ(B) > h(B) / h(A) > 1
In words: the reported ranking survives only if the coherence gap between two engines is narrower than the gap in their observed hazards. The right-hand side is on every dashboard. The left-hand side has never been measured.
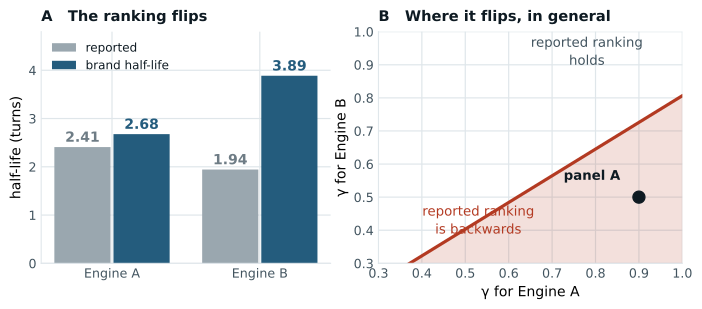
Engine A leads on reported numbers, 2.41 turns against 1.94. Correct for coherence and the order reverses, 2.68 against 3.89. B was the more forgetful of the two, and the drop rate had been recording that forgetfulness as rejection. Cross-engine comparison is among the most commercially consequential things these tools produce, and it is the output most exposed to this. Whether real engines sit inside the shaded region is open, because γ has not been measured for any production engine, ours included.
Recovering γ without a judge
So far γ is a quantity in a model. The question a referee would ask next is whether anything in the data pins it down, or whether it can only be assigned by someone reading transcripts and forming an opinion.
It can be pinned down, and the route is the asymmetry between the two mechanisms. Justified exclusion needs a constraint in the user's turn to act on. Engine incoherence needs nothing; a model can lose its own shortlist regardless of what was asked. So split the transitions by whether the intervening user turn carries any constraint bearing on the brand. On the neutral ones δ is zero by construction, and the drop rate there measures λ alone:
d(neutral) = λ
That single restriction identifies everything else. With d measured across all turns,
δ = (d − λ) / (1 − λ), γ = 1 − ln(1 − λ) / ln(1 − d)
Take a drop rate of 0.30 overall and 0.12 on neutral turns. Then λ is 0.12, δ works out at 0.20, and γ is 0.64. A third of the observed hazard was the engine rather than the brand. The judgment this needs is much weaker than classifying drops. Deciding whether a user turn mentions a constraint relevant to a category can be done from the user's message alone, before anyone looks at what the engine replied. A judge who never sees the outcome cannot be swayed by it, which removes the failure mode that makes drop classification awkward to defend.
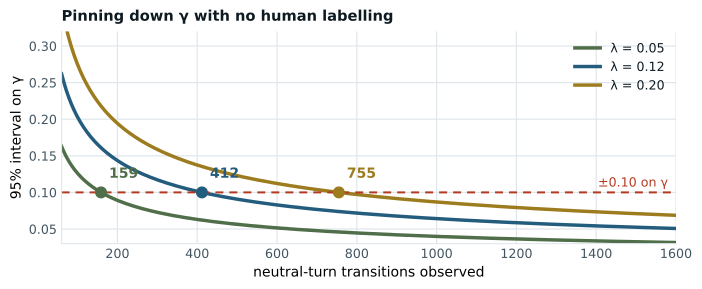
Precision comes from the neutral arm, which is the smaller of the two, so that is where the sampling budget belongs. Between a few hundred and eight hundred neutral transitions gets γ to within ±0.10, depending on how incoherent the engine turns out to be. That is enough to separate a γ of 0.9 from a γ of 0.5, which was the distinction that reversed the ranking above.
Why an engine would do this
Two published results make this more than speculation. One supplies a mechanism, the other a sense of scale.
Start with the mechanism. Jyotiranjan Beuria's study in Scientific Reports, from August 2026, includes a sequential battery in which a model answers a first question and returns a value, that value is inserted into the prompt for a second question, and the model then makes its second judgment while looking at its own prior answer. Across that battery:
- Classical probability identities came out systematically violated. The identities that strained hardest were the partition identities, which require a set of mutually exclusive and exhaustive options to hang together. The departures were model-dependent rather than sharing a common signature.
A recommendation shortlist is a partition over a candidate set. So an engine that names three CRMs and then answers a narrowing question with two names from outside that set has stopped treating its own shortlist as a partition, one turn after producing it.
For scale, Laban and colleagues at Microsoft Research compared single-turn and multi-turn versions of the same instructions across six generation tasks and more than 200,000 simulated conversations:
- Performance fell 39 percent on average in the multi-turn setting. Decomposed, aptitude dropped about 15 percent while unreliability rose 112 percent. The effect appeared even in two-turn conversations. Their summary is that once a model takes a wrong turn it gets lost and does not recover.
Aptitude and reliability map onto justified and incoherent drops fairly directly. Reasoning your brand out of a shortlist takes aptitude. Producing different answers from the same conversational state is unreliability. Since the unreliability term dominates their results by such a wide margin, γ is unlikely to sit near 1, and that is the regime where the correction above stops being a footnote.
Neither result transfers automatically:
- Beuria's models are open-weight and answering with bare numbers, while AI search runs on retrieval-augmented commercial systems writing free-form text. Laban's tasks are code, math and summarisation rather than product recommendation.
- Neither study measures brand presence, which is the quantity we actually report.
What they establish is a plausible mechanism and a plausible size. That is enough to justify measuring γ rather than assuming it away.
Testing the model
The decomposition rests on δ and λ acting independently. That is an assumption, and a conversation gives a way to check it.
The recall probe supplies a second, independent estimate of λ. Once a conversation ends, ask the engine what it recommended earlier.
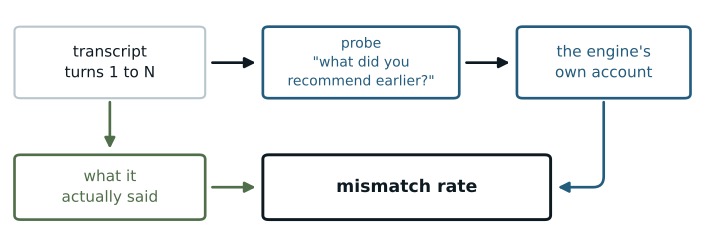
Compare the answer against the transcript. The rate at which an engine cannot restate its own shortlist is a measurement of λ that never touches the drop data at all. So λ is over-identified, with one estimate from the neutral arm and one from the probe, and the two should agree.
Where they diverge, the independence assumption is the first thing to suspect. Turns carrying a constraint tend to be longer and more demanding, and if that raises the chance of a lapse then λ is not constant across the two arms, the neutral estimate is a floor, and γ as computed above is too generous. The gap between the two estimates puts a bound on how much of that is happening. A model that can be checked against itself is worth more than one that cannot, and this one costs a single extra call per conversation.
One caveat on the probe. Turpin and colleagues showed that model explanations can systematically misrepresent the actual reason for an output, staying plausible while omitting the feature that really drove it. So the probe measures what an engine can still reconstruct about its own shortlist. Reading it as an explanation of the underlying decision goes further than the evidence allows, and the reconstruction rate is the only quantity being claimed here.
What changes in the report
Compute half-life on justified drops only. That number describes where your brand actually stands in the conversation, and it is the one a content team should be working against.
Hand-labelling drops as justified or not remains a useful third estimate, worth running on a small sample as a sanity check against the other two, with the usual discipline of a written rubric and two independent reviewers. It should not be the primary route, since it is the only one of the three where the judge sees the outcome before forming a view.
Report γ separately, per engine and per category, since it is a property of the instrument. It belongs beside the visibility number the way a calibration constant sits beside a reading, and without it there is no safe way to compare one engine against another.
Where γ runs low, say so, and downgrade confidence in everything else coming from that engine in that category. An engine that loses its own shortlist inside three turns is not holding a conversation you can measure recommendation behaviour in.
Buyers can put this to a vendor directly. When my brand disappears at turn three, how do you know the engine meant it? Anyone who has measured γ can answer that.
References
- Beuria, J. (2026). Emergent non-classical probabilistic structure in large language models under contextual modulations. Scientific Reports, 19 August 2026. DOI 10.1038/s41598-026-65824-7.
- Laban, P., Hayashi, H., Zhou, Y., & Neville, J. (2025). LLMs Get Lost In Multi-Turn Conversation. ICLR 2026. arXiv:2505.06120.
- Turpin, M., Michael, J., Perez, E., & Bowman, S. (2023). Language Models Don't Always Say What They Think: Unfaithful Explanations in Chain-of-Thought Prompting. NeurIPS 2023. arXiv:2305.04388.
- Kanike, V. (2026). Visibility Has Two Axes: Sampling Variance and Drift. AEOsim.
Figures 1, 2 and 6 are structural diagrams. Figures 3, 4 and 5 are the expressions in the text evaluated directly. None of them plot measured results.
Vignesh Kanike is Founding Engineer at AEOsim, working on measurement methods for multi-turn AI visibility. This piece continues Visibility Has Two Axes. For the product framing of multi-turn survival across the buying conversation, see Conversation Analytics: Chat Is the New Funnel. On clarification turns as recommendation branch points, see Clarification as a Branch Point. Run the multi-turn measurement layer with Analytika.