AEOsim Blog
Clarification as a Branch Point in AI Recommendations: Alternative Clarifying Answers Cut Brand-Set Jaccard Overlap 68% Below Within-Branch Noise
Related measurement work: Visibility Has Two Axes, Visibility Has a Third Axis, and Conversation Analytics.
Table of Contents
You ask an engine which CRM to use. Instead of answering it asks how big your team is, you say four people, and then it answers.
In the visibility tooling we have looked at, that exchange gets logged as one conversation with one answer in it. The clarifying turn counts as overhead, a step on the way to the real output, and we have not seen it measured as a unit of its own. We measured what that turn does. For the product framing of multi-turn buying chats, see Conversation Analytics.
From Ask to Be Sure to commercial visibility
There is an active research question about how a model should ask. Ask to Be Sure (Bai et al., arXiv:2608.15949, CIKM 2026) scores a clarifying question by how much it reduces the assistant's uncertainty, measured as entropy over the recommendation distribution, and uses that reduction as a reward to fine-tune the model toward asking better questions. It is built for whoever is training the recommender.
That framing predicts something we see below. If a good clarifying question concentrates the recommendation distribution, clarified answers should name fewer items than unclarified ones, which is what happened. Their work optimises the question. Ours asks what the user's answer does to the brands on the other side of it.
For commercial visibility the relevant question is different. We wanted to know whether clarification changes the recommendation set, by how much, and whether the user's response is what drives that change.
If that turn substantially changes the recommendation set, then part of commercial visibility gets settled by the user's response to a question the engine chose to ask. The original query and the content behind it account for the rest.
Noise floor, within-branch noise, and branch spread
Run the same query twice and you will get two different recommendation sets. Since run-to-run variation is present even under identical conditions, disagreement between a direct answer and a clarified one cannot by itself be attributed to the clarification. That sampling variance is the first axis in Visibility Has Two Axes.
You have to measure the engine's own run-to-run variance first, then judge everything else against that. Establishing that baseline is most of the work. The comparison itself is straightforward once it exists.
Four overlap measures, all mean pairwise Jaccard overlap between brand sets, plus two churn measures defined further down. Lower Jaccard means the two sets disagree more.
Noise floor. Same query, direct answer, five repetitions. How much does the engine disagree with itself when nothing has changed?
Within-branch noise. Same query, same clarifying answer, three repetitions. This should land close to the noise floor. If it lands well below the floor, clarification is adding instability of its own, which would be a stranger result and would need a different experiment.
Direct versus clarified. Do the post-clarification answers still resemble what you would have got without clarifying?
Branch spread. Three plausible answers to the same clarifying question, compared against each other. This is the primary measure, because it captures the variation the clarifying response itself introduces.
We kept the three clarifying answers realistic and distinct without pushing them to extremes. "Around 15 people, we need custom pipelines" and "about 4 people, we want to set it up in an afternoon" both represent plausible constraints a user might give. Deliberately extreme branches were avoided because they would exaggerate the effect being measured.
The setup was twelve commercial queries across twelve categories, run on GPT-5.6 Luna at low reasoning effort, chosen as a relatively lightweight inference setting. That came to 168 generations per arm, or 336 API calls per arm once brand extraction is counted. Brand extraction ran as a separate pass so the recommendations themselves came out naturally instead of being forced into a schema.
We ran the whole thing twice. The ungrounded arm had no tools available. The grounded arm had the model's web_search tool enabled, capped at three tool calls per generation. Enabling the tool does not guarantee the model used it on every call, so "grounded" here means search was available, not that retrieval always occurred.
Branch spread sits 68% below within-branch noise
| Quantity | Ungrounded | Grounded |
|---|---|---|
| Noise floor (same condition, repeated) | 0.539 | 0.506 |
| Within-branch noise | 0.511 | 0.474 |
| Direct vs clarified | 0.269 | 0.259 |
| Branch spread (different answers) | 0.162 | 0.160 |
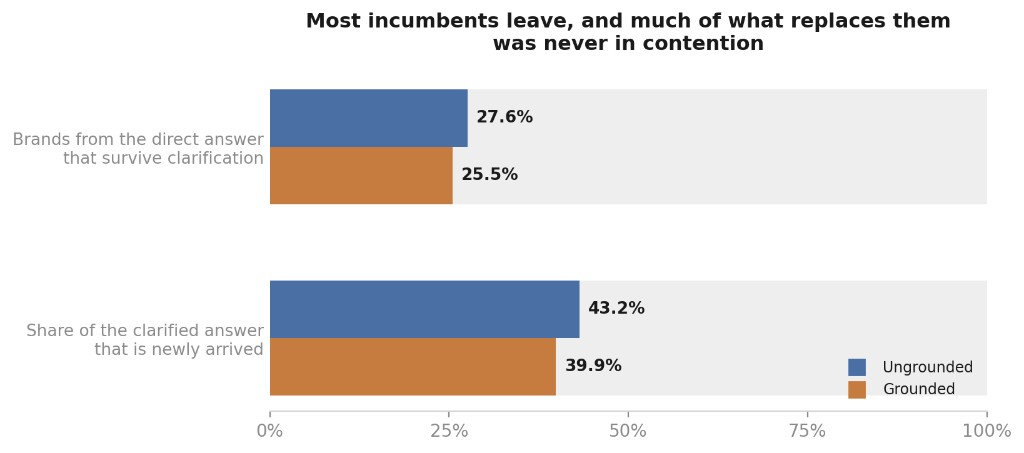
| Survival of direct-answer brands | 0.276 | 0.255 |
| Share of clarified set that is new | 0.432 | 0.399 |
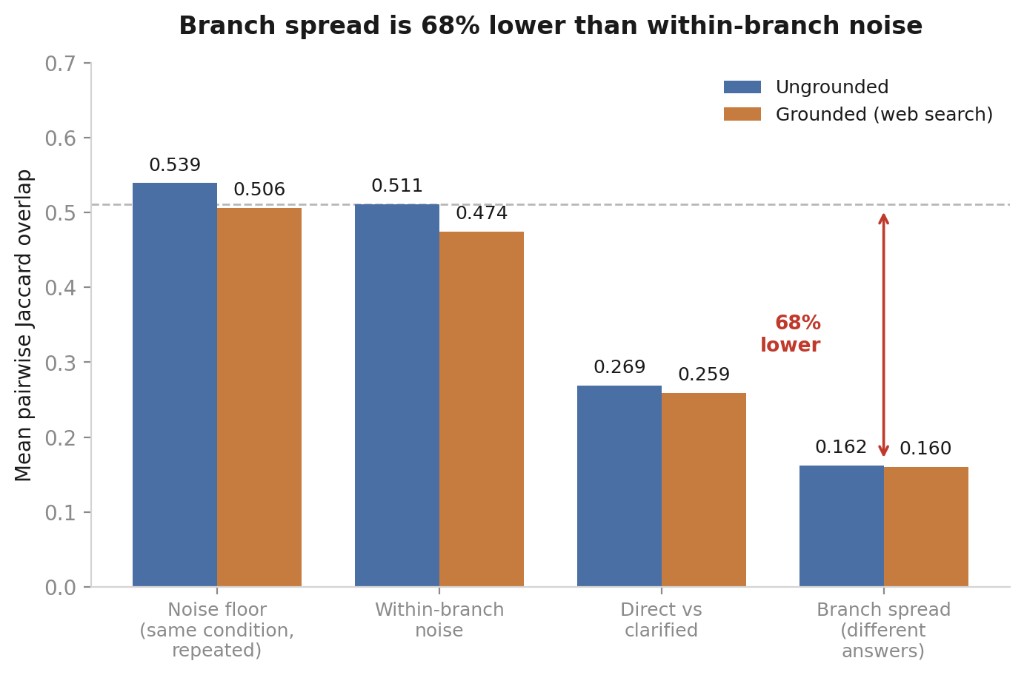
Ordering came out as expected, with noise floor and within-branch noise sitting together near 0.5 while branch spread drops to 0.16.
The comparison that carries the result is within-branch noise against branch spread: 0.511 against 0.162. Both sides draw from the same nine clarified responses per category. The authored answers, generation counts and marginal set-size distribution are therefore identical by construction. Measured, mean set size entering within-branch and cross-branch pairs matches to three decimals, 5.065 both ways ungrounded and 3.806 both ways grounded. Individual cardinalities still vary; what the comparison isolates is pair type over a fixed set of responses. Repeating one clarifying answer leaves the engine about as stable as repeating the bare query, 0.511 against a floor of 0.539. Switching to a different clarifying answer costs 68 percent of the overlap.
| Arm | Within-branch | Branch spread | Reduction | Paired gap | 95% CI | Direction |
|---|---|---|---|---|---|---|
| Ungrounded | 0.511 | 0.162 | 68% | 0.349 | 0.252 to 0.447 | 12/12 |
| Grounded | 0.474 | 0.160 | 66% | 0.313 | 0.211 to 0.415 | 12/12 |
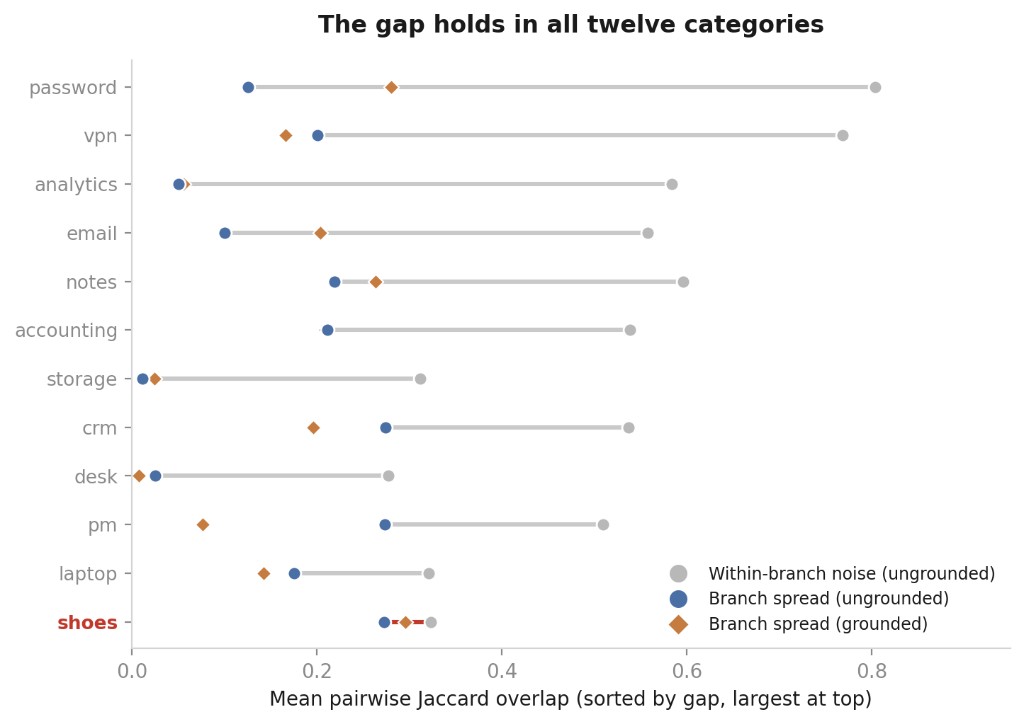
Paired category-level differences are positive in all twelve categories in both arms, and a two-sided exact binomial sign test on those differences gives p = 0.0005 in each.
Against the noise floor the reduction is 70 percent, but that comparison is partly confounded, since direct answers name more entities than clarified ones and Jaccard falls as sets shrink. Drawing random sets at the two sizes puts the mechanical component at 0.016 ungrounded and 0.038 grounded. The within-branch comparison sidesteps most of that, and we measured the remainder: holding each category's actual nine response cardinalities and branch assignment fixed and drawing random sets of exactly those sizes, the null gives within-branch 0.1368 against cross-branch 0.1324. Cardinality structure therefore contributes about 0.004 to the simulated gap, roughly one percent of the observed 0.349.
Direct-union retention and new-brand share
Direct-union retention, which earlier drafts called survival, is the share of the five-run direct union reappearing in a given clarified response: 0.276 ungrounded. It describes the union, not the odds that any single recommendation survives, and its denominator needs care. Retention averages per-response ratios, so its ceiling is the average of per-response ceilings. For each clarified response that ceiling is min(1, |Ci| / |U|), and averaging gives 0.503. Against that, 0.276 is 55 percent of what was achievable. Dividing mean set sizes gives 0.437, but that is a ratio of averages and does not match how the statistic is built. Measured run to run, as one direct answer's entities reappearing in one clarified response, retention is 0.360.
New-brand share is cleaner: 43.2 percent of the entities in a clarified response were absent from the union of all five direct responses, on average.
The weakest category depends on which comparison you use. Against the noise floor, laptops closes to within 0.04 in both arms, and it has the fewest plausible answers, since two or three machines dominate every response. Against within-branch noise the smallest gap belongs to running shoes instead, at 0.051 ungrounded and 0.080 grounded, with laptops at 0.146 and 0.094. Both stay positive. We did not test what drives either.
Positive gaps in all twelve categories
Why direct-versus-clarified sits above branch spread
Direct-versus-clarified overlap (0.269) is higher than branch spread (0.162). A direct response has more in common with any individual clarified response than two clarified responses have with each other.
Set sizes explain it. Direct answers named 5.9 brands on average against 5.1 for clarified ones, and grounded it was 4.8 against 3.8.
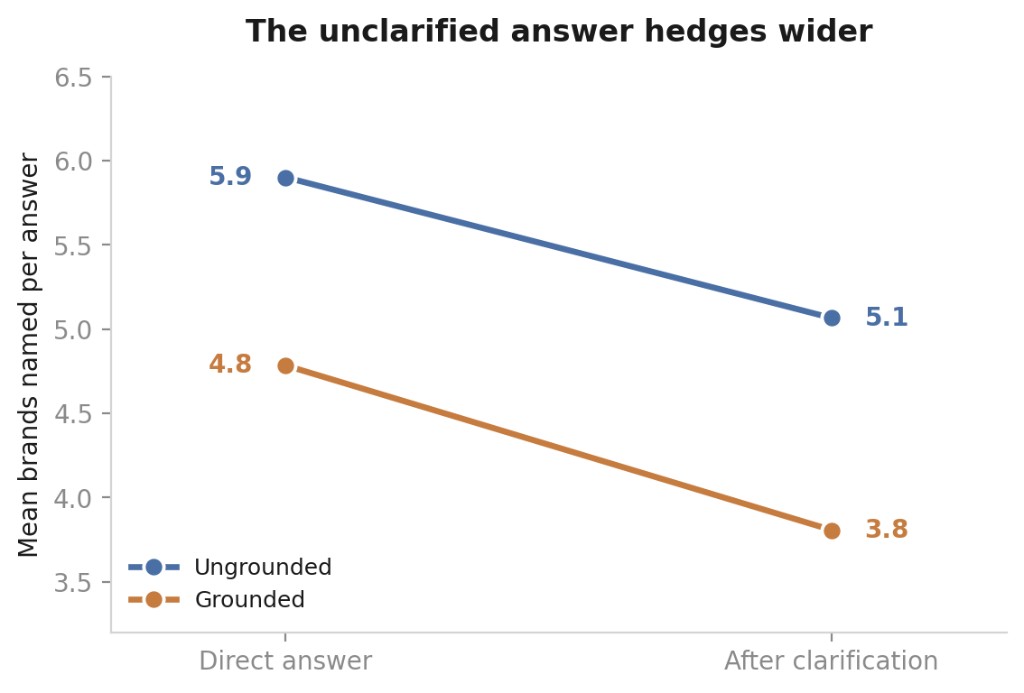
Unclarified responses list more brands, which produces partial overlap with every clarification branch while matching none of them closely. After clarification the set narrows, and different constraints pull it in different directions, so two branches end up further from each other than either is from the wider unclarified answer. Presence in an unclarified answer may therefore be less informative about performance within a specific user segment than an aggregate visibility measure suggests. Separately, Visibility Has a Third Axis covers when a later-turn disappearance is justified exclusion versus engine incoherence.
Branch concentration and tier localisation
The commercially useful question is whether the churn is systematic, meaning whether particular branches reliably pull particular entities.
They do. For every entity we counted appearances across the nine clarified responses and took the share falling on whichever branch claimed most, so an entity confined to a single branch scores 1.0 while one spread evenly across all three scores about 0.33. Averaged over every entity in every category: 0.897, against 0.771 when the branch labels are shuffled, and observed beat its own null in all twelve categories at p = 0.0005.
That average weights every entity equally, so one appearing exactly once scores 1.0 automatically. Restricting to entities seen at least twice gives 0.796 against a null of 0.548; at least three times, 0.739 against 0.519. Dropping the one-offs widens the excess from 0.128 to 0.248, so rare mentions are not driving it. Read the number as evidence of branch localisation, not as a persistence probability.
Stricter still, in the ungrounded arm 36 entities appeared in all three repetitions of exactly one branch and nowhere else, out of 246 entity-category pairs in its clarified responses. About one in seven is locked to a single branch outright.
An obvious objection: if branches mostly swap tiers inside one company, this shrinks at company level. We checked. Collapse every entity to its leading brand token, merging HubSpot Sales Hub Professional into HubSpot, and 244 ungrounded entities become 134. Within-branch noise rises to 0.698 and branch spread to 0.350. That is a 50 percent reduction, not 68. Grounded gives 0.623 and 0.296, a 52 percent reduction. But the paired category-level difference is 0.348 against 0.349 at entity level, still twelve of twelve at p = 0.0005. So roughly half the entity-level effect is tier substitution within a company and half is company-level churn, and direction and significance hold either way.
Those 36 are worth listing. Names below are reproduced as the model generated them in August 2026; packaging may have changed. Answering the CRM clarifier with "around 15 people, we need custom pipelines" locks in HubSpot Sales Hub Professional, Zoho CRM Enterprise and Pipedrive Professional. Answering the password-manager clarifier with "a team of about 12, we need shared vaults" locks in Dashlane Business, Bitwarden Teams and 1Password Business. Answer it with "just me, iPhone and a Mac" and Apple Passwords appears, on no other branch.
So branches move the tier as well as the company. HubSpot showed up under more than one branch, but which Sales Hub tier it recommended tracked the stated team size. That maps onto customer segment far more directly than an aggregate visibility number, and it is measurable one branch at a time.
Grounded vs ungrounded under web_search
We expected retrieval to push this one way or the other. Either it would amplify the effect, since different clarifying answers send different queries to the index, or flatten it, since retrieval tends to keep landing on the same handful of listicles no matter what the user said.
Neither effect appeared. Branch spread was 0.162 ungrounded and 0.160 grounded, and no reported metric in the table differed between arms by more than 0.04. The only real difference was set size, with grounded answers naming about one brand fewer across the board, which is consistent with retrieved evidence producing smaller recommendation sets here.
Under the conditions tested, then, the clarification effect persisted both with and without web retrieval. Retrieval did not eliminate the branch-dependent variation, and that is the part audit design has to account for.
What this changes in audit design
An evaluation that runs one prompt and records the answer is sampling a single clarification branch out of several. Running more repetitions of that same prompt tightens your estimate of that branch, which is useful, but it tells you nothing about how much the answer varies across the other branches a real user might have produced. Those are two different kinds of variance, in the same spirit as separating run-axis noise from turn-axis drift in Visibility Has Two Axes, and most tooling reports only the first.
One caveat for a brand tracking its own presence. Collapsing tiers to companies cuts the reduction from 68 percent to 50, so about half of what moves across branches is which HubSpot appears, not whether HubSpot appears at all. A brand that only tracks its own presence should work from 50 percent.
The noise floor matters here too. Two identical runs agreed on about half the brand set, so small month-over-month movements in an aggregate visibility number should be read against that underlying variance before anyone treats them as signal.
There is an alternative measurement target. If clarification is where the set gets settled, then measuring performance across clarification branches is more informative than the percentage of answers containing a brand, because branches correspond to distinct user segments. A brand can perform very differently on an enterprise branch and a small-team branch while its aggregate visibility stays flat, and the per-branch numbers show that where the aggregate hides it. For whether those answers also misframe the company even when claims check out, see AI Answer Alignment. To run multi-turn branch audits in product, see Analytika.
Methods: GPT-5.6 Luna, extraction, and metrics
Configuration. gpt-5.6-luna via the OpenAI Responses API, reasoning.effort=low, max_output_tokens=2000, other parameters at defaults, run August 2026. The grounded arm passed passed a web_search tool with max_tool_calls=3, everything else at tool defaults. We logged no tool calls, so which queries fired is unrecoverable and the grounded arm cannot be reproduced exactly. As a proxy, all 168 grounded responses cite at least one URL across 135 domains while none of the 168 ungrounded ones do, which is strong evidence search ran on essentially every grounded generation.
Accounting. Per query: five direct responses plus nine clarified (three repetitions of each of three authored answers). 14 generations per query, 168 per arm, each followed by one extraction call, so 336 API calls per arm and 672 total.
Conversation structure. The direct condition sends the query as the only user turn. The clarified condition sends three: query as user, our clarifying question as assistant, branch answer as user. Both share one instruction string asking for prose, specific named products, under 250 words. No system prompt. The clarifying question is held constant across a category's three branches so only the answer differs.
Extraction. A separate call per response, gpt-5.6-luna at reasoning.effort=none, max_output_tokens=600, no tools, returning a JSON array of every named product, service or brand being recommended, in order, excluding those mentioned only to dismiss or compare. One pass per response, so extraction variance is unmeasured and folded into every number. Names were lowercased, stripped of trademark symbols and leading articles, had trailing model-year and chip suffixes removed, then passed through a small alias table. Tiers were deliberately not collapsed to parent brands, so "HubSpot" and "HubSpot Sales Hub Professional" are separate entries. That is what makes the tier result visible, and it inflates counts against a parent-brand normalisation. We use "brand" as shorthand for whatever the extractor returned, which may be a parent brand, a product or a tier.
Metrics. Write D1 to D5 for the five direct responses of a category, U for their union, and the nine clarified responses as three repetitions of each of three branches. Jaccard overlap J(A,B) is the size of the intersection over the size of the union, taking J = 1 when both sets are empty. Ordering is discarded throughout.
- Noise floor: mean J over the 10 pairs among D1 to D5.
- Within-branch noise: mean J over the 3 pairs inside each branch, averaged over branches.
- Branch spread: mean J over cross-branch pairs, per branch pair then averaged over the 3 branch pairs. With three repetitions per branch, branch-pair and pair weighting are equivalent.
- Direct versus clarified: mean J over all 45 direct-clarified pairs.
- Direct-union retention: overlap of U with a clarified response over the size of U, averaged over the 9.
- New-brand share: entities in a clarified response absent from U, over the size of that response, averaged over the 9.
- Branch concentration: for an entity, the largest per-branch count of clarified responses containing it, divided by the total. Confined to one branch scores 1.0, spread evenly scores about 0.33. Averaged over entities, then categories.
Category-level values are averaged unweighted across the twelve categories.
Statistics. For uncertainty we bootstrapped the twelve category-level within-branch minus branch-spread differences, 20,000 resamples, percentile 95 percent interval; with twelve categories as the resampling unit, treat it as descriptive. For direction we ran a two-sided exact binomial sign test on the same differences, which speaks only to the twelve categories tested. The concentration null permutes whole responses across branch labels within a category, preserving 3/3/3 sizes, over 400 permutations; 0.771 is the mean of the per-category null means, each category scored against its own. The set-size simulation draws pairs without replacement from each category's pooled entity list at the rounded observed cardinalities, 400 draws each, reporting the Monte Carlo difference in expected Jaccard.
Commercial visibility, here, means whether an entity appears among those explicitly recommended in a response. Nothing about rank, sentiment or what the user then chose.
Pilot limits: one model, authored branches, Jaccard without rank
Twelve queries makes this a pilot, and per-category variance ran high enough, with standard deviations around 0.22 on the noise floor, that the aggregate indicates a direction and little more.
We tested one model. Luna is not what ChatGPT serves a consumer by default, and its web search tool is a different thing from the retrieval stack behind the product. The same framework could in principle run against ChatGPT, Perplexity or AI Overviews, but we did not evaluate those.
We supplied the clarifying question ourselves, so it stayed constant across branches; the model never generated one. That isolates the branch effect and tells you nothing about how often clarification actually happens in real conversations.
The three answers to each question are ours too, and that is the deepest limitation. Branch spread is a joint property of the engine and of how far apart we chose to place three plausible responses; a different trio gives a different number, so read the absolute 0.162 with that in mind. The comparison against within-branch noise survives it, since both sides use the same authored answers and only the branch label moves. But we are not publishing the wording of the twelve queries and thirty-six answers, so nobody can recheck the magnitude against our stimuli.
Reasoning effort stayed at low throughout, and higher effort might change branch sensitivity. Extraction ran once per response, so its own variance is unmeasured and sits inside every number here. The extractor is the same model family that wrote the answers, which makes the measurement layer an LLM reading an LLM. Our only check was cheap: all 1,599 extracted entities across both arms, 901 ungrounded and 698 grounded, have their leading token present in the source text, so nothing was invented outright. Entities it missed, or wrongly counted as recommendations, would need a human annotation study we have not run.
Jaccard treats each recommendation as an unordered set, so a brand sliding from first mention to fifth registers as no change. Position surely matters to whoever is reading the answer, and none of these numbers capture it.
There is no human baseline. We show the recommendation set moves, not that anyone's eventual choice moves with it.
Treat clarification as a branch point
For the twelve queries and the one model tested, alternative plausible clarification answers moved the recommendation set substantially more than repeated sampling of the same branch did. In these results clarification behaves like a branch point in the recommendation process, and evaluation should treat it as one. Evaluation that counts each original query as one independent observation will miss the variation that alternative clarifying responses introduce, and on this evidence that variation runs larger than the engine's own run-to-run noise.
Search-visibility metrics treat each query as an independent observation. Conversational systems add a step where the user's reply changes what comes next, and current evaluation still counts one query as one observation.
References
- Bai, Y., et al. (2026). Ask to Be Sure. CIKM 2026. arXiv:2608.15949.
Vignesh Kanike is Founding Engineer at AEOsim, working on measurement methods for multi-turn AI visibility. Related reading: Visibility Has Two Axes, Visibility Has a Third Axis, and Conversation Analytics. Run multi-turn measurement with Analytika.